Examples
1) Kinetics type distribution from curated BioModels Database. The blue bars investigate the kinetics type distribution on the average of all the reactions from all the models. The orange bars indicate the distribution on the average of reactions for each model. The trend for two color bars is qualitatively similar. The error bars on the top of orange bars represent the uncertainty among different models.
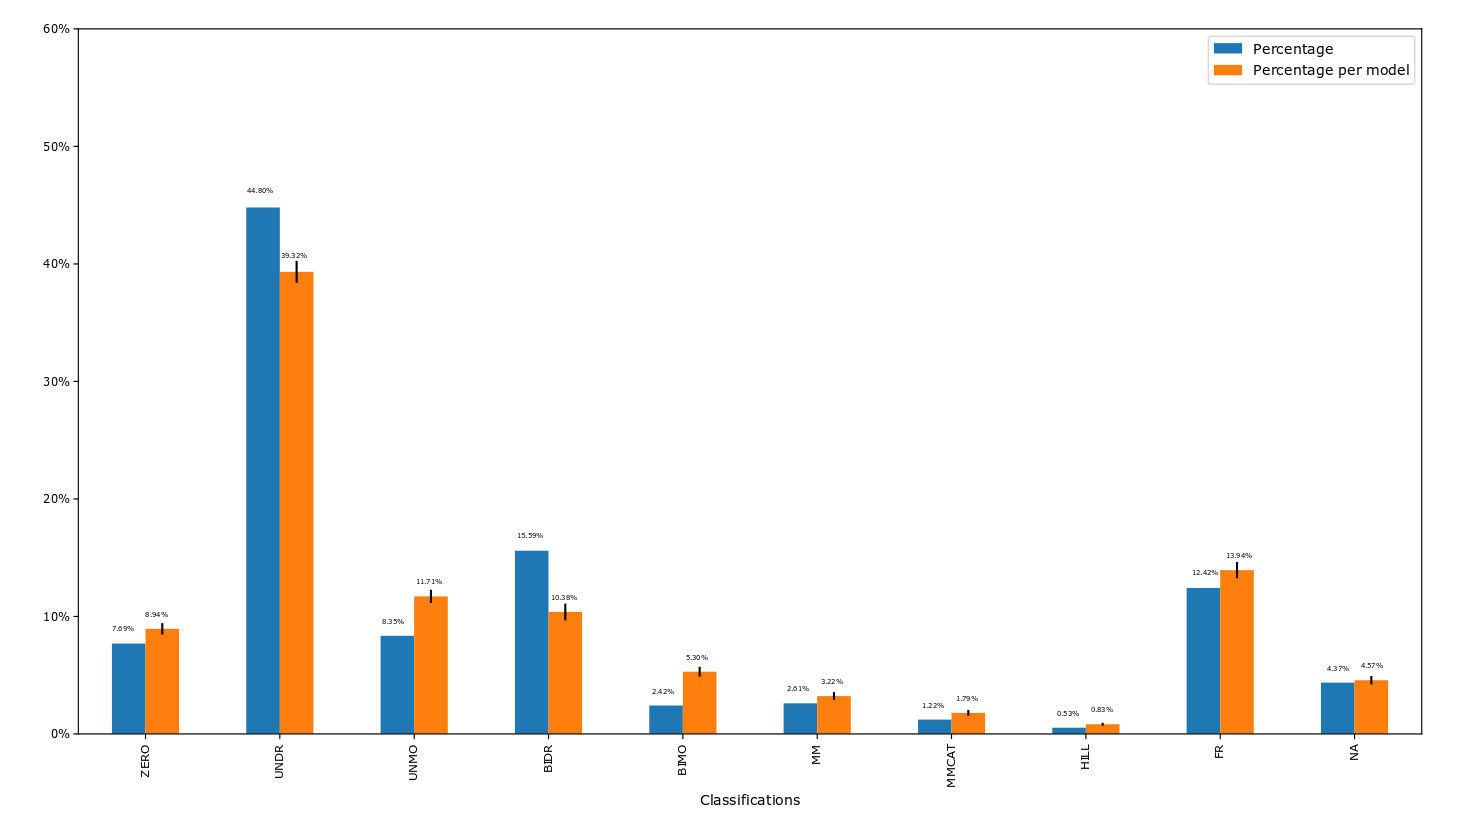
Based on the result of Figure 1 from curated BioModels, users can select UNDR with the highest probability as the general kinetics of mass action to model synthetic reaction networks. Users can also follow its distribution to assign the probability for each type of kinetics while generating random synthetic reaction networks. In detail, users can assign the probability values of generating reaction networks from the certain kinetics of ZERO, UNDR, UNMO etc.
2) Kinetic law type distribution for signaling networks (A) and metabolic networks (B) from BioModels Database. The blue bars investigate the kinetics type distribution on the average of all the reactions from all the models. The orange bars indicate the distribution on the average of reactions for each model. The trend for two color bars is qualitatively similar for each subplot. However, there is a significant difference of the kinetics type distributions between the signaling and metabolic networks. The error bars on the top of orange bars represent the uncertainty among different models.
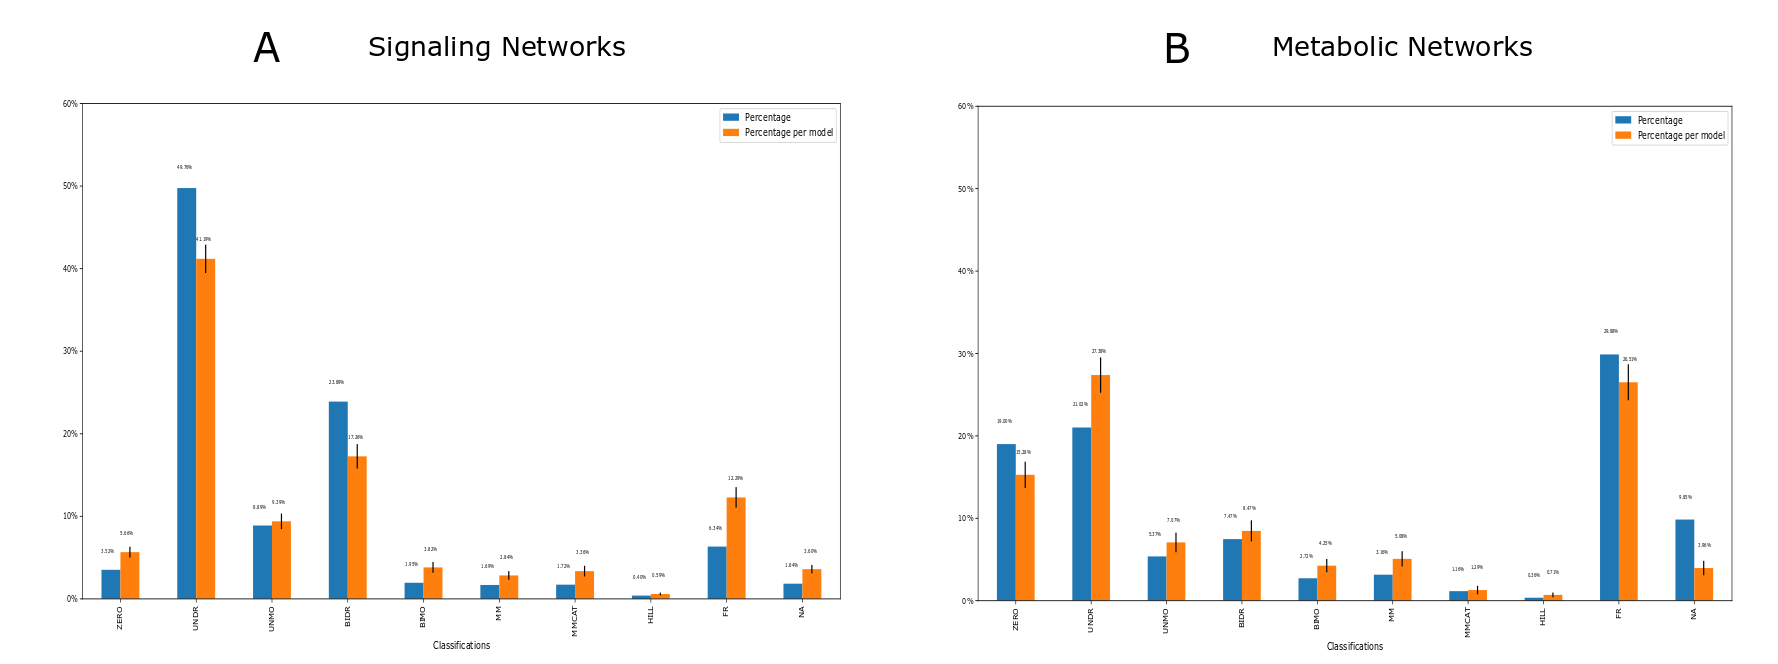
If users want to model synthetic signaling networks instead of metabolic networks, they can refer to the distributions of Figure A instead of Figure B.